Machine Monitoring Software for Real-Time Factory Visibility
M-Connect machine monitoring software turns the signals your machines already produce into a live picture of the shop floor — what is running, what has stopped, and what it is costing you. Working alongside our M-Connect IoT hardware, the platform powers MES workflows, OEE tracking and production monitoring for manufacturers across India.
Machine monitoring software connects to each machine and records what it is doing — running, idle, stopped, in alarm — continuously and without an operator writing anything down. M-Connect does this on CNC, welding, stamping, injection-moulding and conventional machines, including older Fanuc and Siemens controllers, using a gateway per machine and no modification to the machine.
What is machine monitoring software?
Machine monitoring software reads each machine's own signals and keeps a continuous record of what it did — how long it ran, how long it stood idle, when it stopped and why — so the shift record is measured rather than remembered. The M-Connect web application is where that record is read: machine status, utilisation, downtime classification and reports in one interface. Explore how this platform supports Manufacturing Execution System (MES) implementations and see results in our real-world implementation stories.
What each M-Connect module tracks
| Module | Function | Data captured |
|---|---|---|
| Real-time machine monitoring | Live status of every connected machine on one screen, so a supervisor sees a stoppage as it happens instead of at the end of the shift. | Running / idle / stopped / alarm state, machine utilisation %, cycle time, production counter, operator on shift |
| OEE and production analytics | Calculates OEE automatically and benchmarks it across machines, shifts and departments. | Availability, performance, quality, overall OEE, output vs target, historical OEE trend with drill-down |
| Downtime and idle-time analysis | Times and classifies every stoppage so the biggest losses can be attacked first, rather than the loudest ones. | Stoppage start and duration, planned / unplanned / maintenance category, reason code, idle time between cycles, frequency of repeat stoppages |
| Energy monitoring | Ties power consumption to the machine and the job running on it, including what the plant burns while idle. | kWh per machine, energy cost per unit or batch, peak demand, idle-state consumption, shift and monthly totals |
| Reporting suite | Five standard reports covering utilisation, output, downtime, OEE and energy, exportable for review meetings. | Shift-wise, daily and monthly breakdowns by machine, line, department and period. Export to Excel or PDF. |
| Mobile app and role dashboards | The same data cut for each role, from the operator at the machine up to the MD. | Separate views for MD and leadership, production head, production manager, floor supervisor and quality team |
What reports come out of it?
Detailed reports designed to support data-driven decision-making at every level of the organization.
Machine Utilization Report
Displays machine operating time, idle time, and downtime across selected time periods. Identify underutilized assets and optimize scheduling.
- Shift-wise breakdown
- Machine-wise comparison
- Period selection
- Export to Excel/PDF
Production Output Report
Part production data and throughput trends for individual machines or entire production lines. Compare actuals vs targets.
- Target vs actual
- Shift-wise output
- Machine-wise production
- Trend analysis
Downtime Analysis Report
Detailed classification of machine stoppages and their cumulative impact on production efficiency and OEE.
- Reason code classification
- Duration analysis
- Frequency tracking
- OEE impact
OEE Performance Report
Track equipment effectiveness across machines, departments, and production shifts with drill-down capability.
- Availability / Performance / Quality
- Multi-machine OEE
- Historical trends
- Benchmark comparison
Energy Consumption Report
Machine-level energy usage and operational efficiency insights for cost reduction and sustainability goals.
- kWh per machine
- Cost per unit
- Idle consumption
- Carbon footprint data
The mobile app
Who sees what — dashboards by role
Senior leadership gains a high-level overview of factory performance through strategic dashboards.
- Overall factory production performance
- Plant-level machine utilization
- OEE trends across departments
- Energy consumption insights
- Production output vs targets
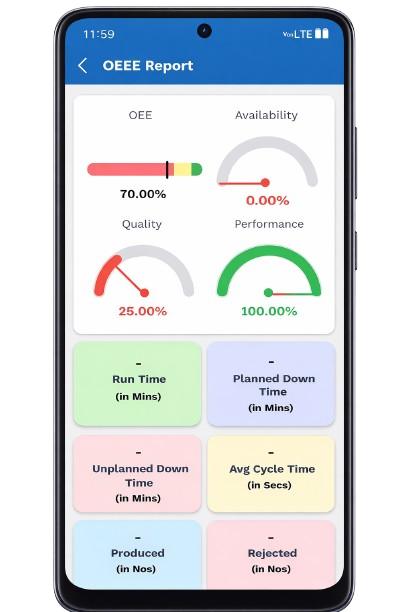
This enables executives to monitor manufacturing performance and make strategic decisions based on real-time data.
Production heads can track key operational metrics aligned with their performance goals.
- Machine utilization trends
- OEE performance metrics
- Production achievement vs targets
- Downtime distribution analysis
- Department-level productivity
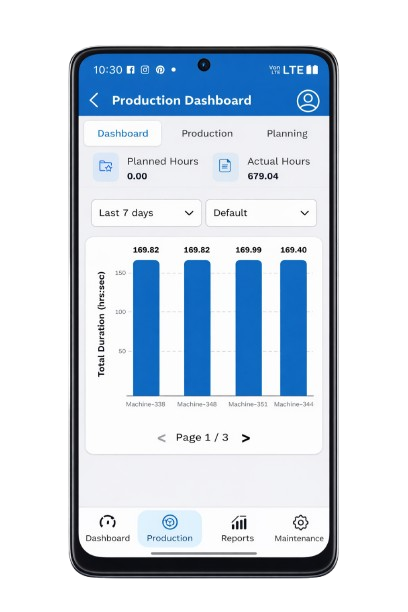
These insights support effective production planning and operational control.
Production managers gain real-time visibility into machine-wise output and shift performance.
- Machine-wise production tracking
- Production progress monitoring
- Downtime alerts and notifications
- Shift-wise production analysis
- Workload balancing insights
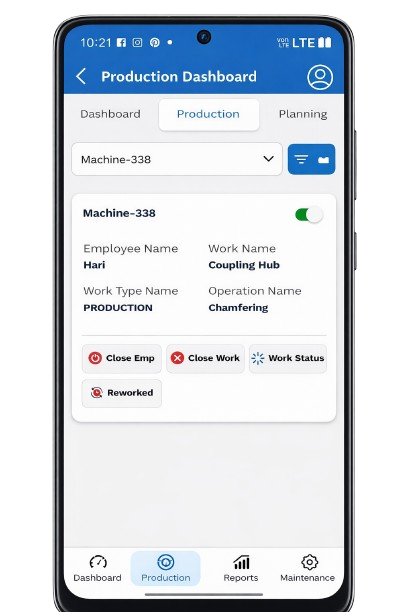
This enables faster response to operational issues and improves production coordination.
Shop-floor supervisors gain real-time visibility into machine operations and production activity.
- Live machine status monitoring
- Machine idle and downtime alerts
- Production count monitoring
- Shift performance tracking
- Operator response coordination
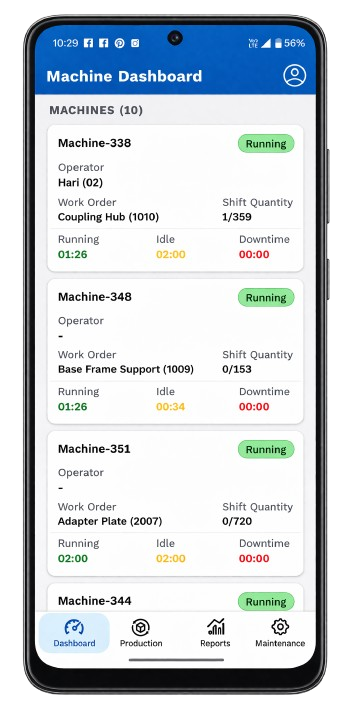
This ensures smooth shop-floor operations and timely resolution of machine interruptions.
Quality teams can monitor production consistency and detect quality-related issues early.
- Production batch tracking
- Quality inspection data integration
- Production trend monitoring
- Quality performance indicators
- Non-conformance alerts
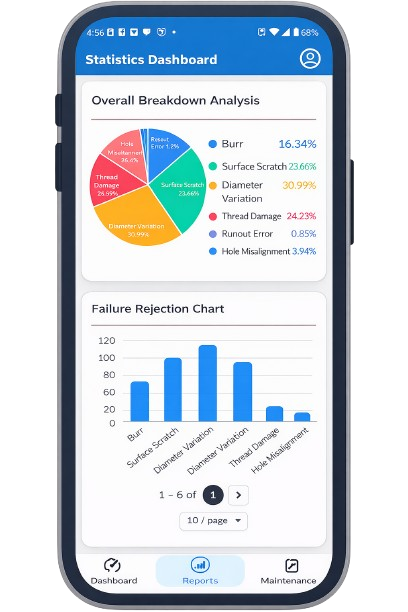
This helps maintain consistent product quality and reduces defect rates.
An Indian platform, built in Coimbatore
The M-Connect platform is developed and supported by Maestro Technology Services Pvt. Ltd. from Vilankurichi, Coimbatore, Tamil Nadu. That is a deliberate advantage rather than an address on a footer: the industries this platform was built around — automotive components, textiles, foundry, pumps and motors, metal fabrication — are the industries within an hour’s drive of the office.
It also shapes what the software assumes. M-Connect assumes older machines and mixed controllers. It assumes patchy network coverage in one corner of the shed, so the gateway fails over between Wi-Fi, 4G and LAN on its own. It assumes the plant head wants one screen, not a BI licence. Those are decisions that come from working in Indian factories, and they are the difference between a monitoring system that is still running in month six and one that quietly stops being opened.
Related solutions
The M-Connect software platform integrates with our complete smart factory ecosystem.
Industrial IoT Gateways
Purpose-built hardware devices that capture machine signals and transmit real-time data to power our software platform.
Explore HardwareManufacturing Execution System
Connect production, machines, and operators with MES capabilities for execution control and shop-floor visibility.
Explore MESTransform Your Factory with
Smart Manufacturing
Connect your machines, gain real-time visibility, and unlock hidden capacity with M-Connect's Industrial IoT intelligence platform. Read our manufacturing blog and factory transformation stories.
 Contact Sales
Frequently asked questions about machine monitoring
Deployment, security, mobile access and multi-plant visibility.
What features does the M-Connect software platform include?
M-Connect includes real-time machine monitoring, an OEE analytics dashboard, downtime and idle-time analysis, energy monitoring, production order management, quality check sheets, ERP/SAP integration, the Eagle View multi-factory dashboard, and a mobile app for Android and iOS.
How quickly can M-Connect be deployed in a factory?
Standard deployment: with out-of-the-box features and standard gateway hardware, the system can be deployed and made operational within 30 days.
Custom features and third-party integrations: for solutions involving custom dashboards, reports, workflows, or ERP/MES integrations, implementation may take 3 to 6 months, depending on complexity and specific requirements.
Installation itself is faster than people expect: a gateway wires into the machine’s existing panel, and machines can be brought on gradually without stopping production.
How is data stored and secured? (On-premise, cloud, hybrid?)
We support flexible deployment options including Cloud (self-managed), Maestro-managed Cloud on AWS, and on-premise installations. Our multi-layered security architecture includes:
- Endpoint Validation: every data message validated using a custom salt-based signature for authenticity and tamper protection
- Protocol-Level Encryption: all data transmissions use HTTPS and MQTTS, encrypted with SSL/TLS and AES standards
- Network Security: strict firewall rules and network-level isolation where applicable
The platform also supports Role-Based Access Control (RBAC) and detailed audit logs for traceability and compliance.
Is M-Connect available on mobile devices?
Yes. M-Connect is available as a web application and as a mobile app for Android and iOS, allowing factory managers to monitor machine status and production from anywhere.
Can M-Connect monitor multiple factories?
Yes. M-Connect’s Eagle View Management feature provides a unified dashboard to monitor and compare performance across multiple production plants in real time.
Does M-Connect support energy monitoring?
Yes. M-Connect tracks machine-level energy consumption and analyses power usage patterns across the factory, helping identify energy-intensive equipment and reduce overall energy costs.
Can M-Connect integrate with SAP or other ERP systems?
Yes. M-Connect supports ERP and SAP integration, enabling data synchronisation between the shop floor and enterprise systems for unified operational reporting.